Challenge
Before the moment of the project, the client was using a custom Project Management System and in 2010 they started implementing a collaboration platform based on SharePoint Foundation 2010.
The client wanted to integrate the two systems. To begin with, they needed to see a series of statistics and charts of the data in the Project Management System.

Solution Implemented
The Project Management Dashboard is an improved Portal created with SharePoint.
The first step was to discuss with the customer’s representatives and create a list of the data they wanted to make available in the portal. Both Project Management System and the Collaboration Platform were using Single Sign-On authentication.
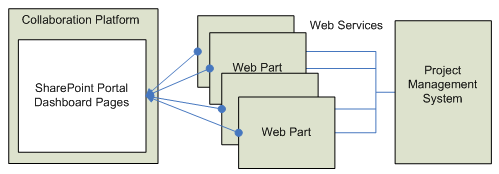
Together with the client we decided for an implementation based on Web Parts using standard SharePoint controls that would feed on Web Services provided by the Project Management System. This approach provides a uniform GUI through the collaboration platform.
The client was already using 3rd party controls in order to obtain these in the Project Management System and preferred using the same controls for this task also.
Project Development

The project was split in 3 phases.
- Project Management System extensions
- Implementation of statistics Web Parts
- Implementation of Chart Web Parts
After the first phase had been completed and each Web Service tested, we started implementing the Web Parts.
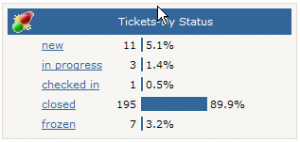
Most of the web parts were implemented using GridViews and provided Excel export functionalities and access to Project Management System through web links. Of course there were some exceptions like in the image above, for which we implemented some custom html.
For the last implementation phase our developers found a work around that allowed us to avoid moving large amounts of data and reprocess it in order to generate chart views. They observed that the 3rd party controls used in Project Management System were storing the generated images on the disk and reused them to avoid processing.
So what we did was to implement some simple services that would allow us to import this image and display them in the screens of the collaboration platform.

Benefits
The evaluations and the graphics generated by PReS can be used to:
- visibility to see what has been done and what still needs to be completed
- assigning resources to tasks or projects
- easier communication through the uploading and sharing of files, collaborating on an online space and emailing updates through the system
- permanent evaluation of the project status and possibility bring about changes or correct what went wrong
SPECIFIC SERVICES
Software Consulting
Requirements management
System analysis
Risk analysis
Process management
Software Development
Architecture design
Software implementation
Software test
Project management
Software Services
Maintenance
Software tuning
User training
Testing & QA
Functional testing
Unit testing
Automated testing
Load/Performance testing
Static testing
Standardized ITMS Services
Change/ Problem/ Incident/ Release management
NEARSHORING ADVANTAGES
- Quality custom software development
- End -user satisfaction
- Short time to market
- Quantifiable value
- Guaranteed performance level
- Reduced and controlled costs
- Managed risks
- Good value-for-money
- Flexibility
